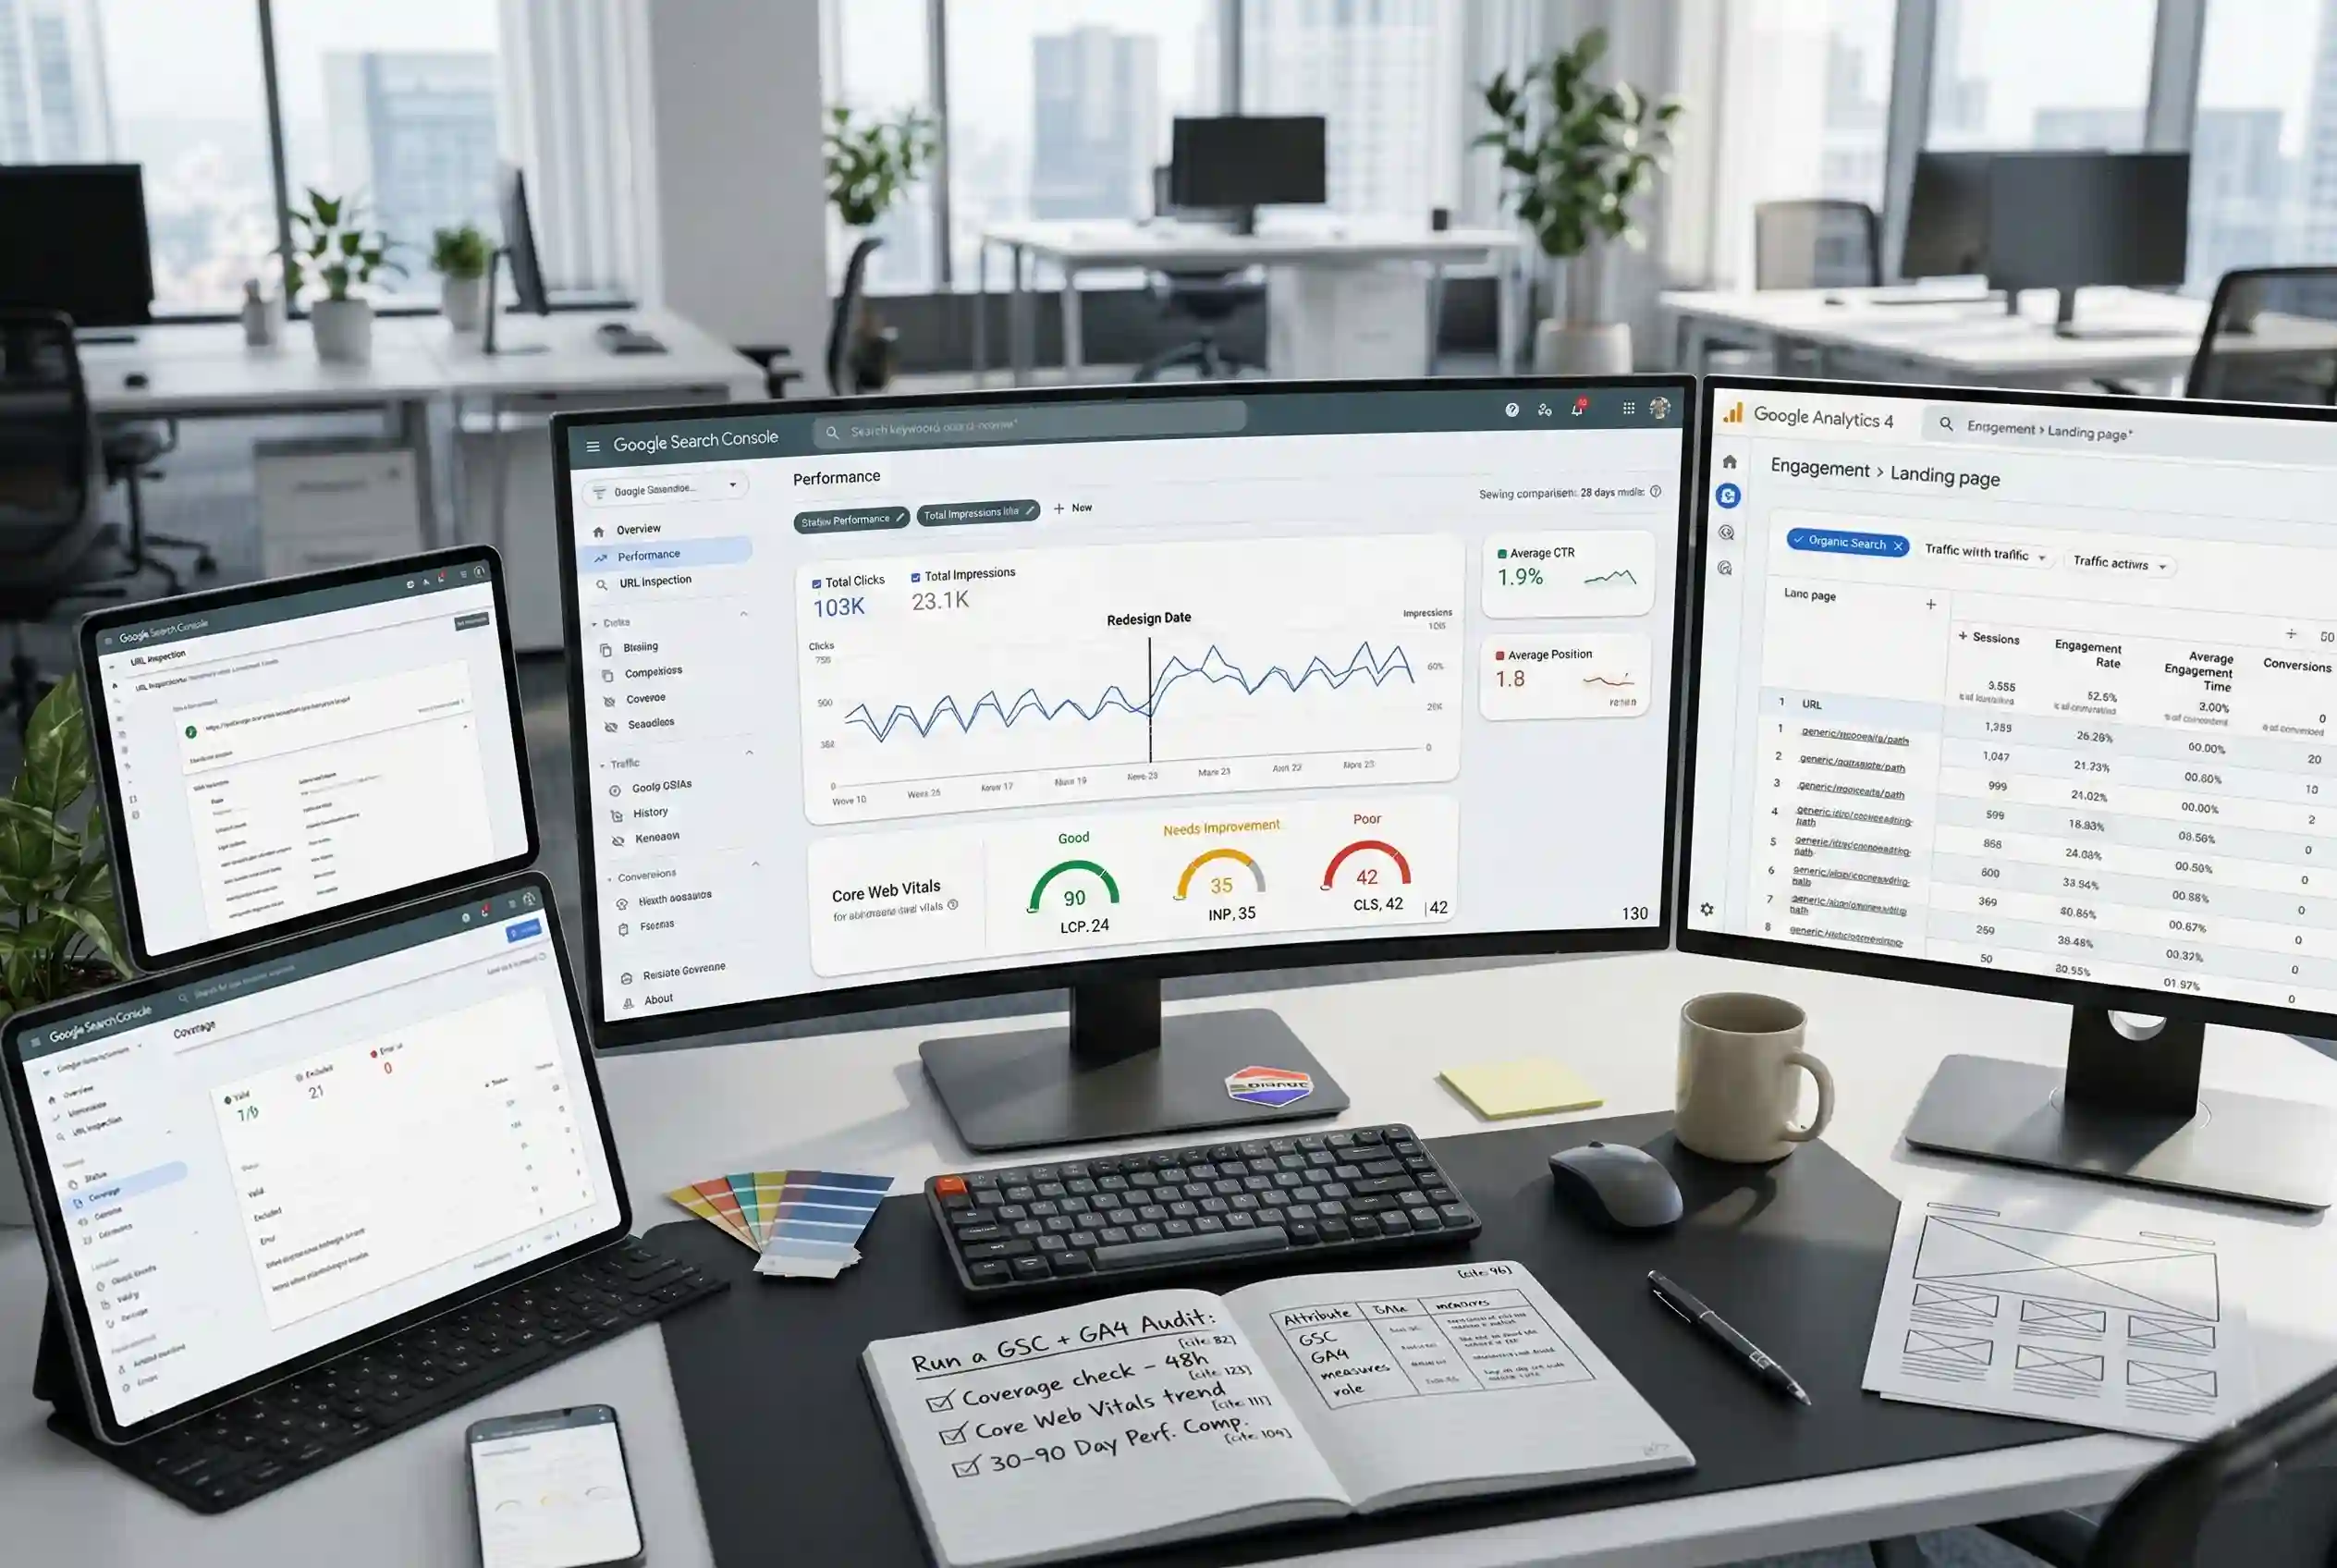
A website redesign does not automatically improve search performance. The only way to know whether your SEO web design decisions worked is to measure them. GSC and GA4 give you that data. Each tool covers a different part of the user journey from search and you need both to get a complete picture.
This guide covers which reports to use, what numbers to look at, and how to run a structured audit using these two tools after any design change.
Pages that received layout changes are the first place to look. Redesigns frequently shift Core Web Vitals scores before any ranking movement appears in GSC, and engagement signals in GA4 often change before traffic numbers do.
What Google Search Console Shows About Your SEO Web Design
GSC measures how Google crawls, indexes, and ranks your pages. Every metric in GSC traces back to decisions made during the design and build phase. When you change a page’s layout, load weight, or structure, GSC is where you verify the result.
Core Web Vitals Report
GSC’s Core Web Vitals report draws on real-user field data to score pages on three metrics:
- LCP (Largest Contentful Paint): how fast the main content loads
- INP (Interaction to Next Paint): how quickly the page responds to user input
- CLS (Cumulative Layout Shift): how stable the layout is as the page loads
CLS is the metric most directly tied to design decisions. A CLS score above 0.1 signals layout instability, typically caused by images without set dimensions, late-loading fonts, or elements that shift as the page renders. If a redesign introduced new visual elements, check this score first.
Use this report to confirm whether a design change improved or degraded field performance. The report groups pages into “Good,” “Needs Improvement,” and “Poor” based on the 75th percentile of user data (source: Google Search Console documentation, developers.google.com). A drop in the Good count after a redesign is a direct signal to investigate the layout.
Search Results Report (Performance Report)
The Search Results report in GSC tracks four metrics at the page level:
- Total Clicks: how many users clicked through to your page from search
- Total Impressions: how many times your page appeared in search results
- Average CTR: the percentage of impressions that turned into clicks
- Average Position: your page’s mean ranking across all queries it appeared for
Filter by page to isolate the pages that received design changes. Use the date comparison feature to set a before-and-after window around the redesign date. A drop in CTR with stable or rising impressions often indicates that a title tag or meta description was changed during the redesign and no longer matches what searchers expect to find.
Coverage Report
The Coverage report confirms which pages Google has indexed and whether any are blocked. After a redesign, check for:
- Pages newly marked as Excluded due to noindex tags added during development
- Crawl errors on URLs that were restructured or redirected
- Valid pages that dropped from the index without explanation
A redesign can introduce indexing issues without any visible sign on the front end. The Coverage report catches these before they affect rankings for an extended period.
URL Inspection Tool
For individual pages that show drops in the Search Results report, run them through the URL Inspection Tool. This shows whether the page is indexed, when it was last crawled, and whether Google’s rendered version matches what you intended. Use this to confirm that design changes to specific landing pages were picked up correctly.
What GA4 Shows About SEO Web Design Performance
GA4 measures user behavior on your site after visitors arrive from organic search. Where GSC shows you what happened before the click, GA4 shows you what happened after. A page can rank well and still lose visitors within seconds if the design creates friction.
Organic Traffic by Landing Page
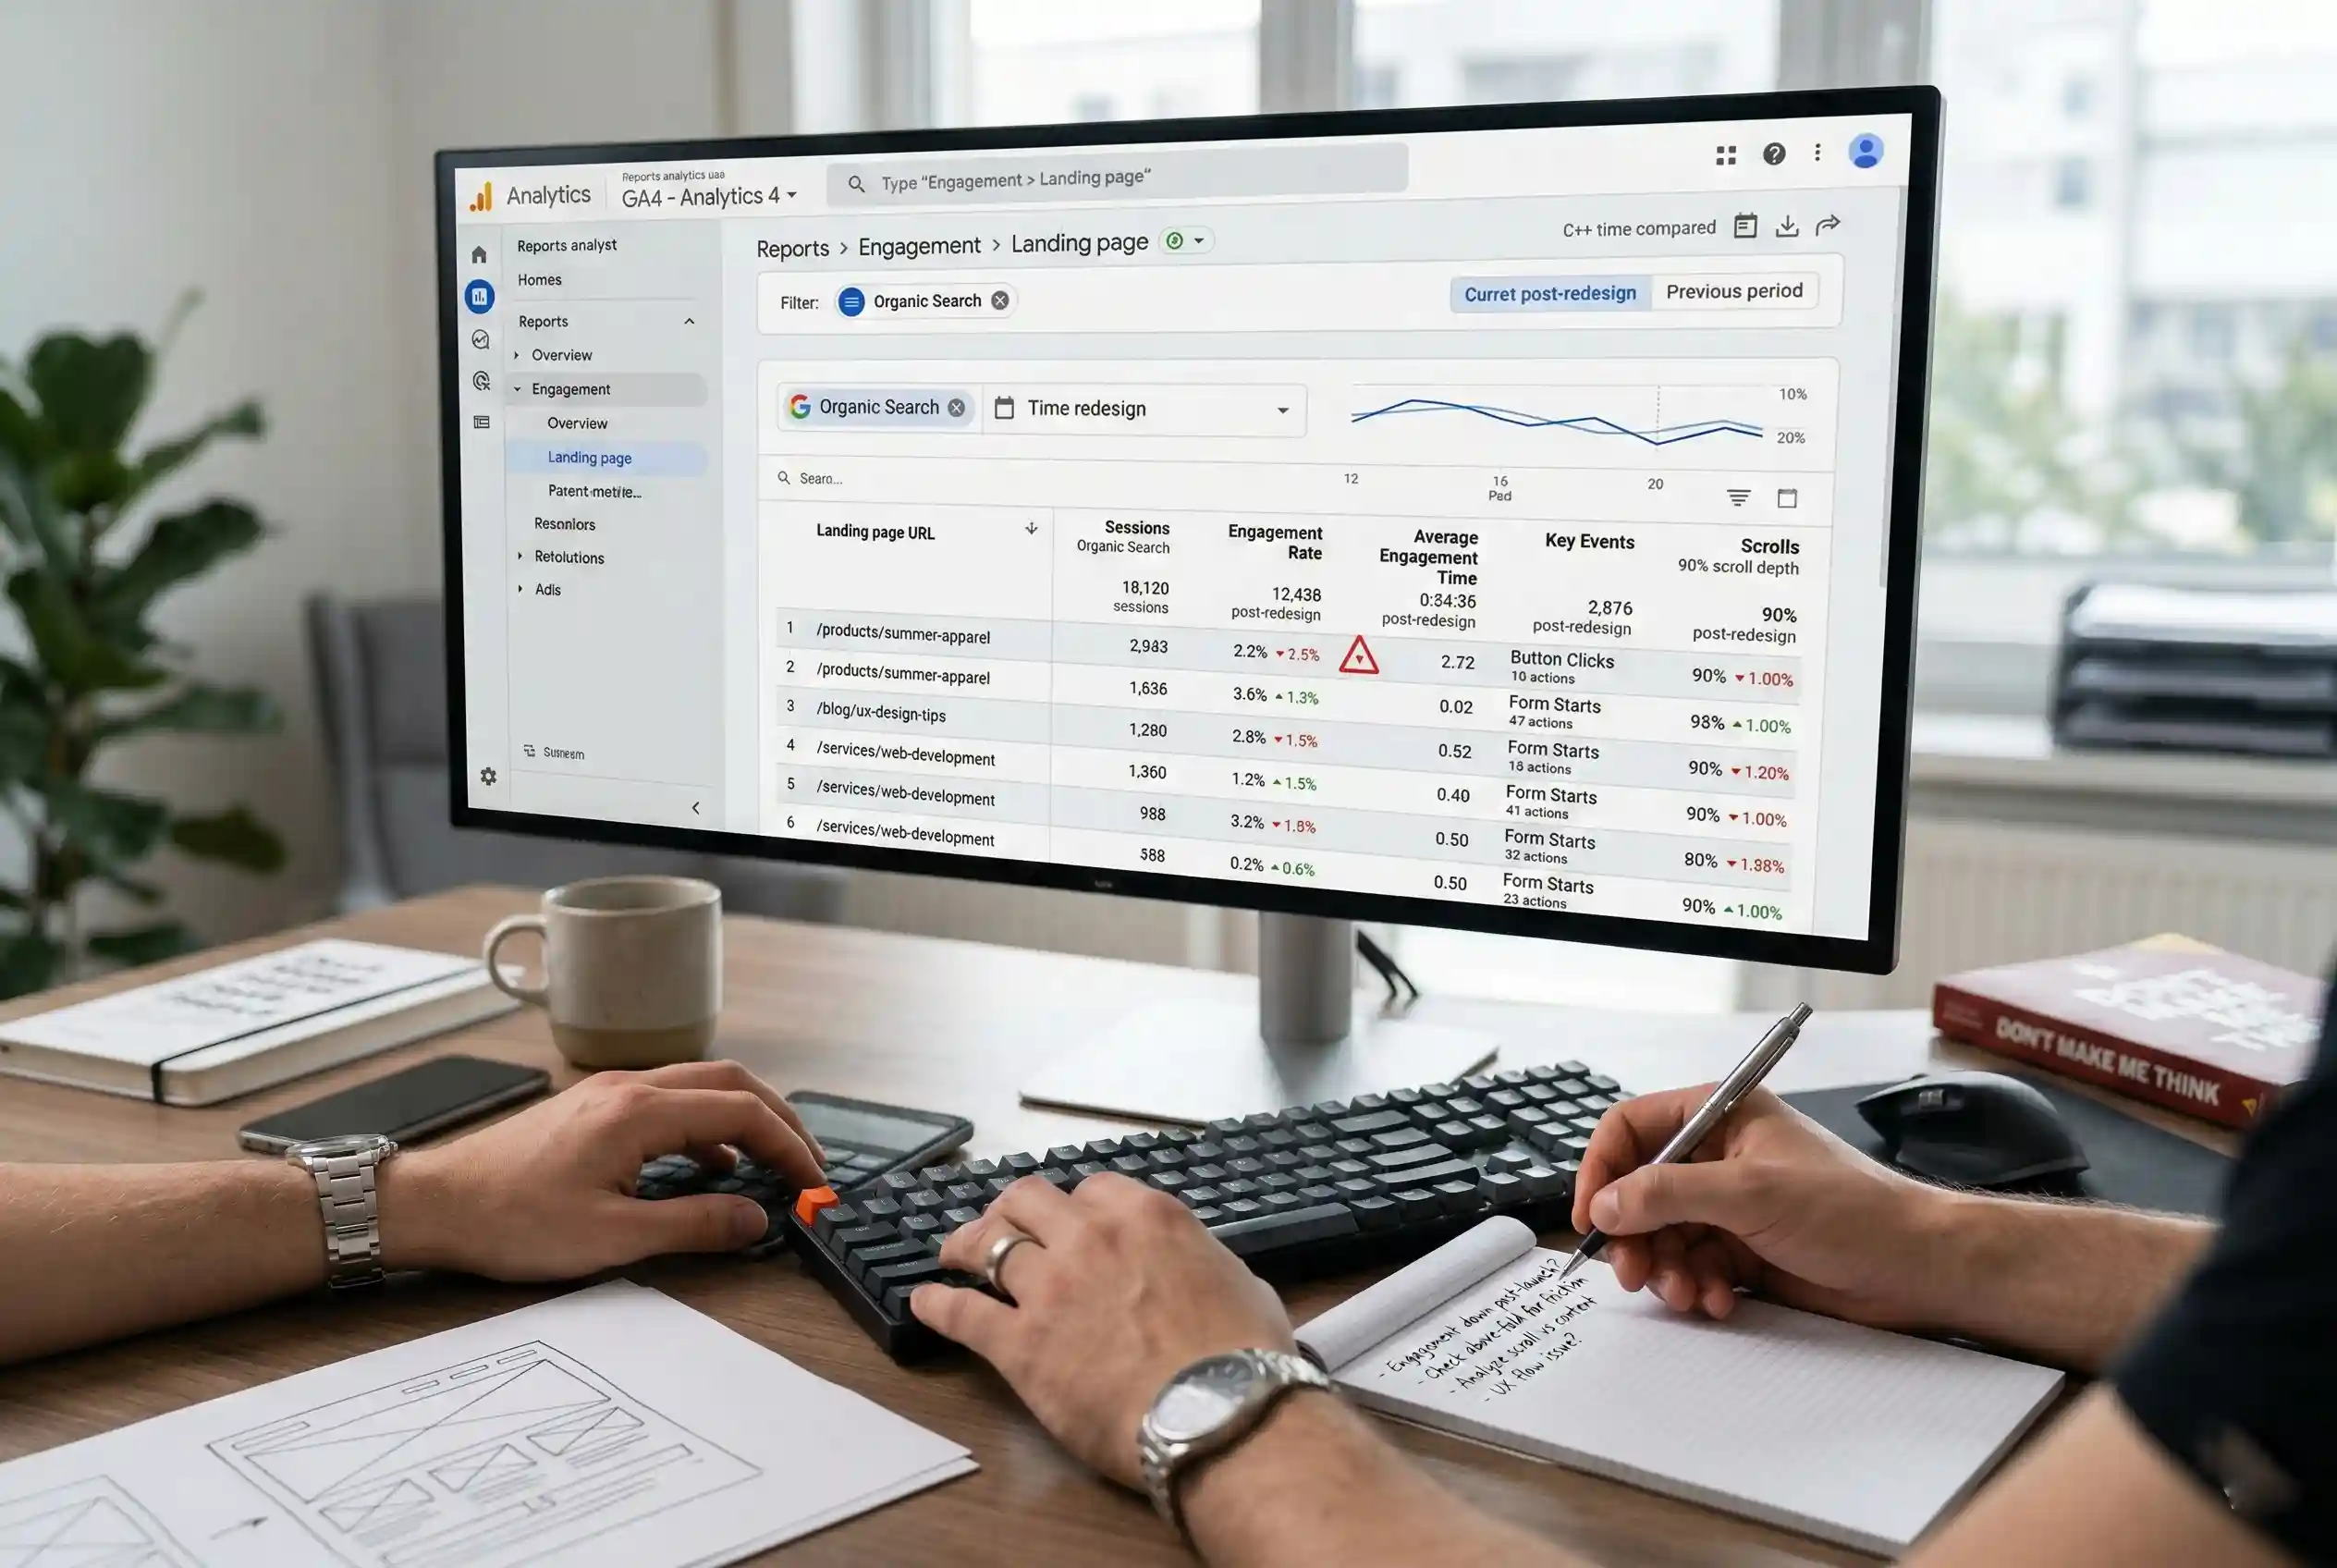
To isolate organic search behavior in GA4, go to Reports > Engagement > Landing page. From there, apply a filter to show only Organic Search traffic. The metrics to track per landing page are:
- Sessions: total organic visits to that page
- Engagement Rate: percentage of sessions lasting longer than 10 seconds, triggering a conversion event, or viewing more than one page
- Average Engagement Time: how long engaged sessions lasted on that page
Cross-reference these numbers against the pages that received design changes. A page with rising organic sessions but a falling Engagement Rate after a redesign suggests the new layout is not holding visitors who arrive from search.
Engagement Rate vs. Bounce Rate
GA4 replaced the traditional bounce rate with Engagement Rate as the primary session quality metric. An engaged session requires at least 10 seconds on the page, a conversion event, or a second pageview. This makes Engagement Rate a more reliable signal for design-related issues than the old bounce metric.
A low Engagement Rate on organic landing pages often points to a mismatch between what the page promises in search results and what the layout delivers. If the above-the-fold area is heavy, slow, or cluttered, visitors from search will leave before the page registers as engaged.
Scroll Depth and User Engagement Events
GA4 tracks scroll depth as a default event. When a user scrolls 90% down a page, GA4 logs a scroll event. If redesigned pages show a drop in scroll events among organic visitors, the layout may be interrupting reading behavior before users reach the content they came for.
For pages with CTAs, set up key events to track interactions such as button clicks or form starts. This gives you data on whether design changes to conversion elements affected organic visitor behavior, not just paid traffic.
How to Use GSC and GA4 Together for an SEO Design Audit
Neither tool alone tells you whether a design change helped or hurt SEO performance. GSC tells you whether the page is found and ranked. GA4 tells you whether visitors stay once they arrive. The audit connects both.
How to Run a GSC + GA4 SEO Web Design Audit
- Open the GSC Search Results report. Set a date range of 28 days before and 28 days after the design change.
- Filter by page. Export CTR, impressions, and average position for each redesigned page.
- Open GA4 > Reports > Engagement > Landing page. Apply an Organic Search channel filter.
- Match date ranges. Note Engagement Rate and Average Engagement Time for the same pages.
- Open the Core Web Vitals report in GSC. Check whether the redesigned pages moved into or out of the “Poor” or “Needs Improvement” categories.
- Record all findings against the original design hypothesis. Flag pages where GSC and GA4 signals conflict or confirm each other.
Audit Validation Signals
Use these signal combinations to read the data:
- Positive: Impressions up, CTR stable or improving, Engagement Rate up – the design change supported search performance.
- Negative: Impressions up but CTR declined – the title tag or meta description may have been altered during the redesign and no longer matches search intent.
- Negative: CTR stable but Engagement Rate dropped post-redesign – the layout change may be creating friction for visitors who land from search.
- Negative: Core Web Vitals score worsened for redesigned pages – new design elements are adding layout instability or load weight.
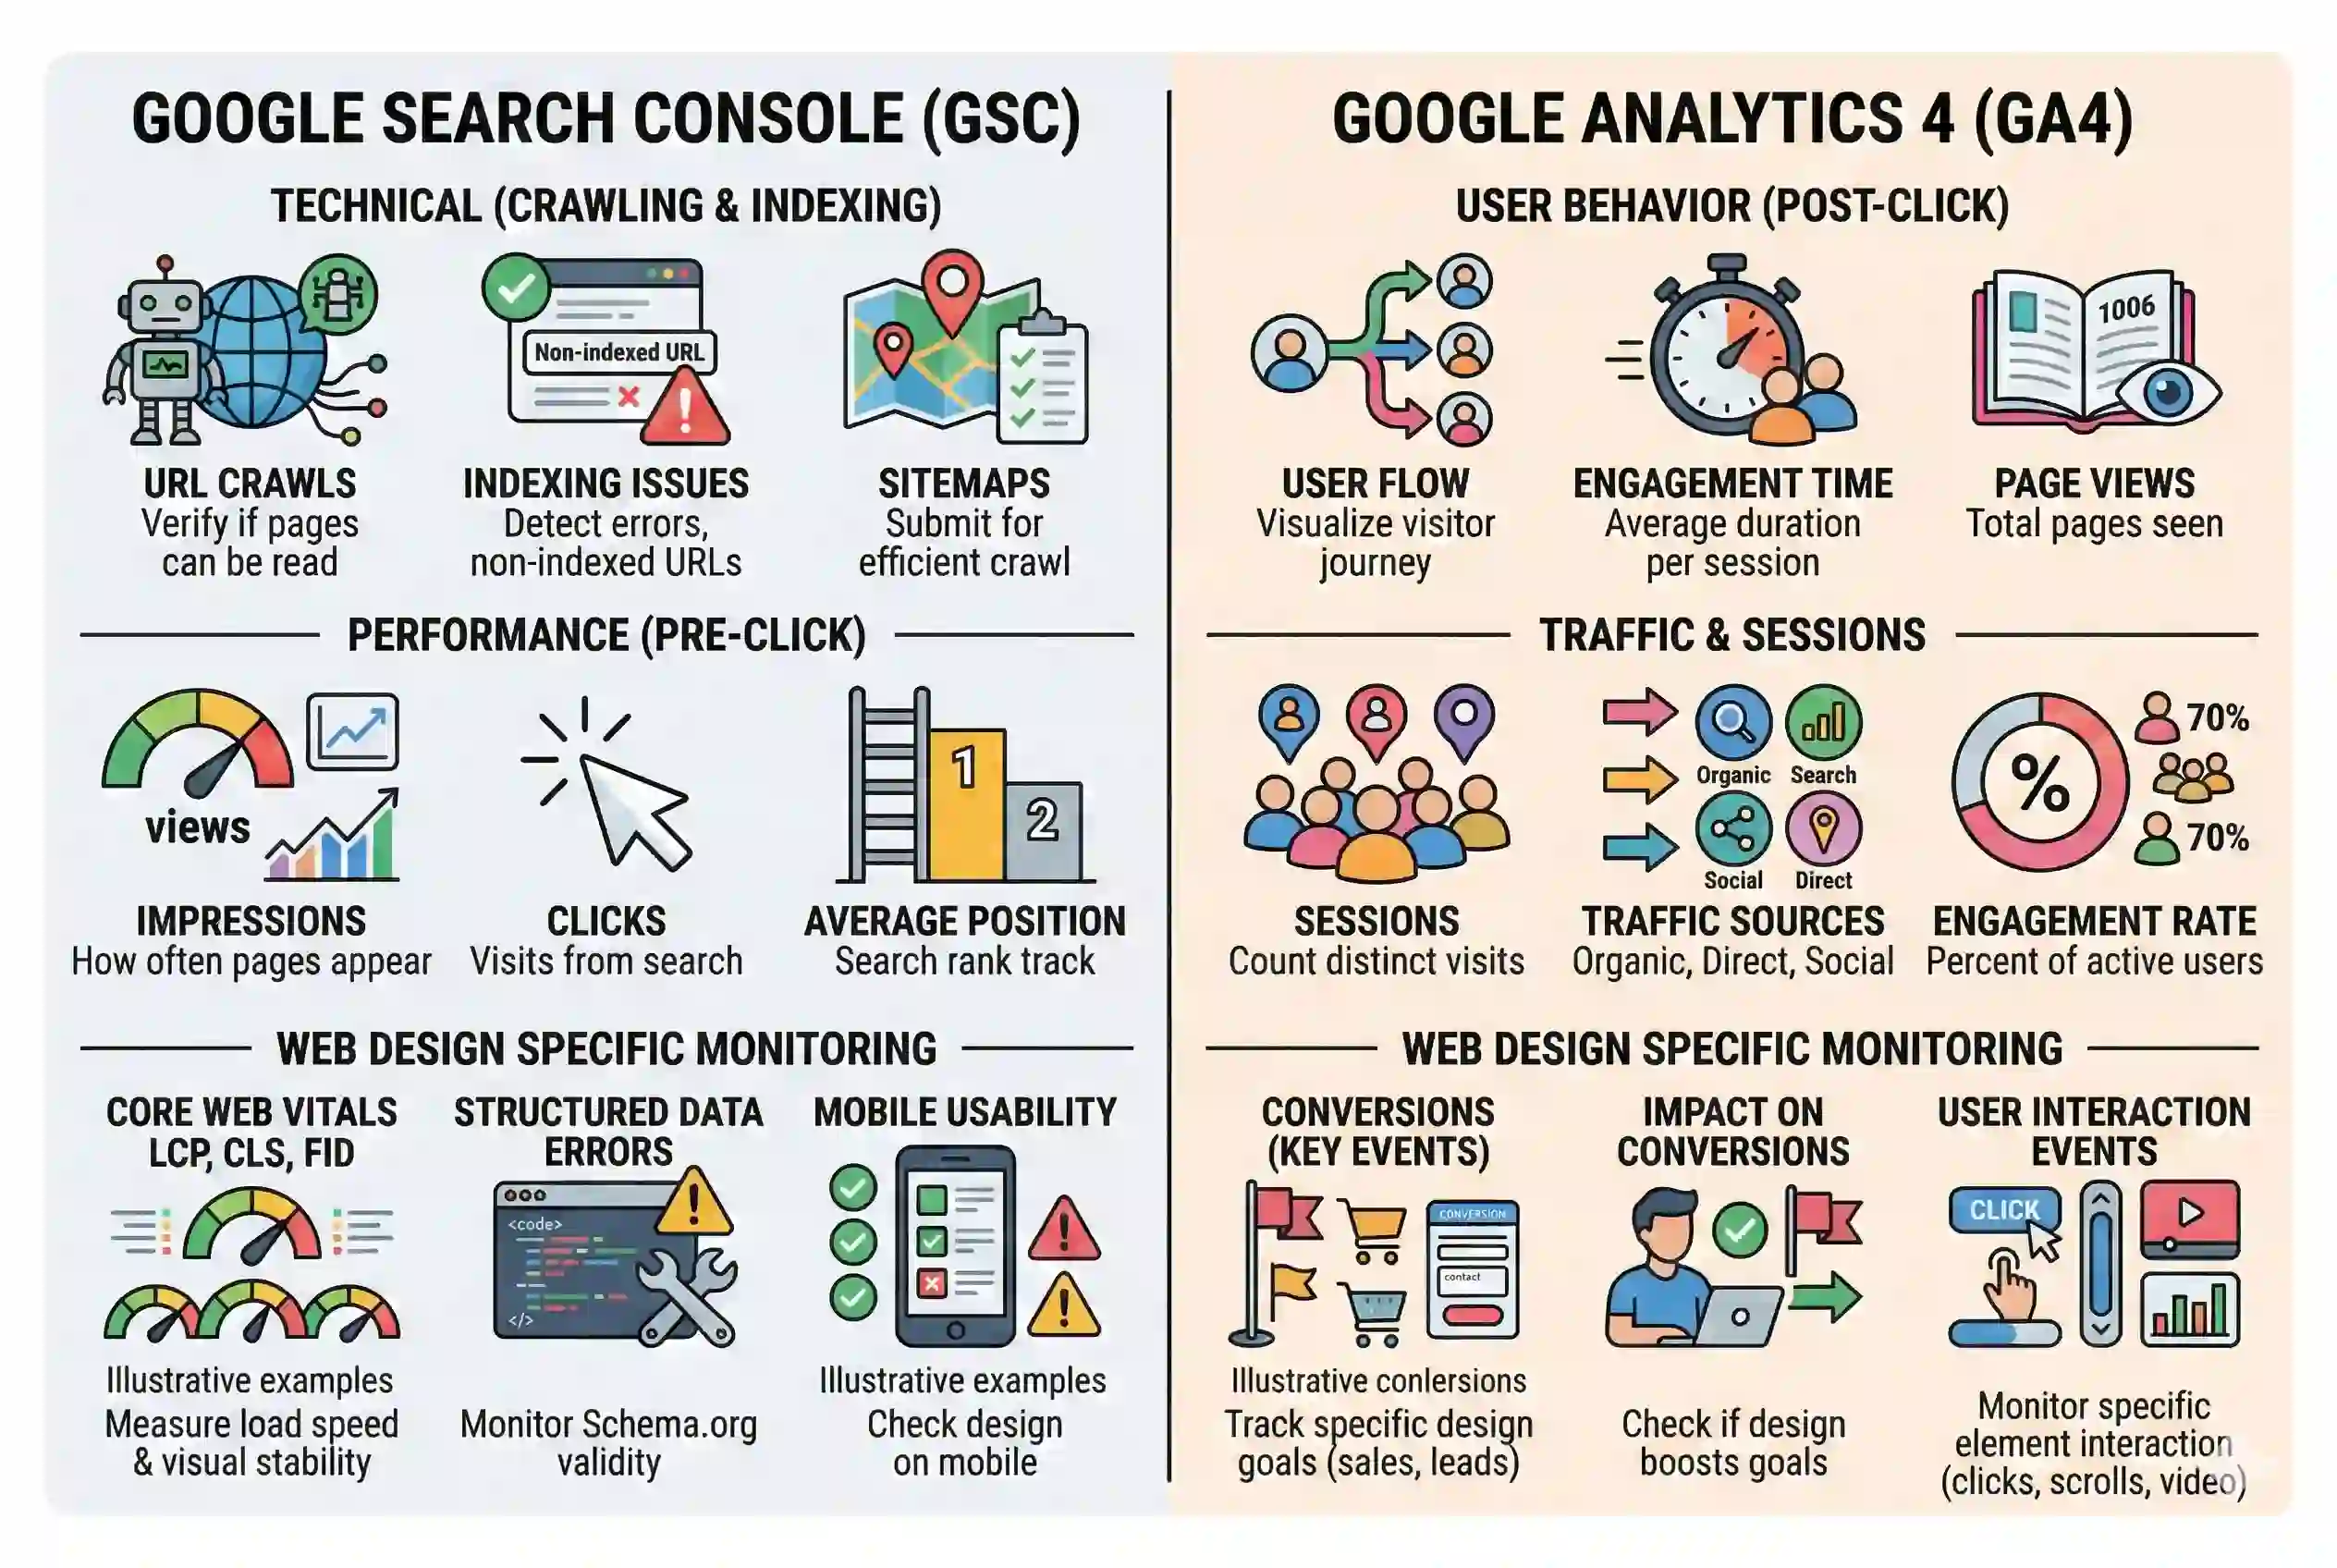
GSC vs. GA4 for SEO Web Design Monitoring
Attribute | Google Search Console | Google Analytics 4 |
What it measures | How Google crawls and ranks your pages | How users behave after clicking from search |
Design-relevant data | Core Web Vitals, crawl errors, impressions | Engagement Rate, session duration, scroll events |
Timing of data | Search performance (pre-click) | User behavior (post-click) |
Best used for | Confirming indexing and search visibility | Confirming user experience and engagement |
Audit role | Supply signal: is the page found? | Demand signal: is the page held? |
Performance Tracking Cadence for SEO Web Design Monitoring
Search data takes time to reflect design changes. Running the audit at the wrong interval produces misleading conclusions.
Days 1–30 After a Redesign
Check the GSC Coverage report and run URL Inspection on key pages within 48 hours of the redesign going live. The goal at this stage is to confirm that critical pages are indexed and that no crawl errors or accidental noindex tags were introduced.
Watch the Core Web Vitals report for regressions. Field data updates gradually, but early signals of poor CLS or LCP scores are actionable. Do not draw traffic conclusions from this window — GSC search performance data has a processing delay and organic ranking shifts take time to appear in the data.
Days 30–90 After a Redesign
Organic traffic trends typically need 4–8 weeks to stabilize after a structural site change. This is the window to start comparing GSC Search Results data before and after the redesign. Look at the same set of pages and compare impressions, CTR, and average position.
Run the GA4 Engagement report in parallel. By day 45, you should have enough data to identify whether Engagement Rate patterns on redesigned pages are above or below their pre-redesign baseline.
Ongoing Monthly Review
Set a recurring monthly check that covers:
- GSC: Core Web Vitals trends, any new crawl errors, and position changes on key landing pages
- GA4: Engagement Rate by landing page filtered to organic, and any shifts in Average Engagement Time
Record each month’s findings alongside any design updates made during that period. Over time, this builds a documented record of which design decisions correlate with search performance changes.

Strategic Takeaway
GSC and GA4 serve different but connected roles in monitoring SEO web design performance. GSC tells you whether Google found, indexed, and ranked your redesigned pages. GA4 tells you whether visitors from search stayed long enough to count as engaged. Running both as a paired audit, at the right intervals, gives you the data to confirm whether a design decision supported or undercut your SEO objectives.